
In the world of energy trading, one key metric that plays a crucial role in evaluating the profitability of petroleum refiners is the crack spread. The crack spread refers to the profit margin that a refiner can achieve by processing crude oil into various petroleum products like gasoline, diesel fuel, or jet fuel. This article delves into the significance of the RBOB/Brent crack spread, its components, and its role in energy trading.
Understanding RBOB and Brent
To comprehend the RBOB/Brent crack spread, it’s important to first understand the two components that make up this metric. RBOB, an acronym for “Reformulated Gasoline Blendstock for Oxygen Blending,” is a type of gasoline used as the benchmark for gasoline trading on the Chicago Mercantile Exchange. It gained prominence in the United States as legislation banned the use of gasoline containing the chemical MTBE (Methyl tert-butyl ether) due to its harmful impact on groundwater.
On the other hand, Brent crude oil serves as the global benchmark for crude oil. It is a type of light sweet crude oil extracted from the North Sea, comprising Brent Blend, Forties Blend, Oseberg, and Ekofisk crudes. Brent crude oil is known for its relatively low density and low sulfur content, making it ideal for pricing nearly 65% of all global crude oils.
The Crack Spread: Evaluating Refiners’ Profits
The crack spread measures the difference between the value of gasoline and crude oil. It allows traders and refiners to evaluate the profitability of refining activities. Refining crude oil involves a downstream process where oil is heated and introduced into a distillation tower. In this tower, the crude oil is broken down into various petroleum products, with lighter components like gasoline rising to the top while heavier components like residual oil settle at the bottom.
There are two main components to the profit margin that a refiner can achieve. The first component is the difference between the price of crude oil and the price of gasoline. The second component is the difference between the cost to generate gasoline and the price at which gasoline can be sold. The cost to generate gasoline includes the value of crude oil plus the distillation process.
Calculating the RBOB/ Brent Crack Spread
The RBOB/Brent crack spread specifically refers to the difference between the price of RBOB gasoline and the price of Brent crude oil. RBOB gasoline is quoted in US cents per gallon, while Brent crude oil is quoted in US dollars per barrel. To make a direct comparison, the crack spread is quoted in US dollars per barrel. This is achieved by converting RBOB gasoline prices from cents per gallon to US dollars per barrel, using a conversion factor of 42 (as each RBOB futures contract contains 42,000 gallons of gasoline).
To calculate the RBOB/Brent crack spread, subtract the price of Brent crude oil from the converted price of RBOB gasoline. The resulting figure represents the crack spread, indicating the profitability potential for refiners.
Analyzing the RBOB/ Brent Crack Spread

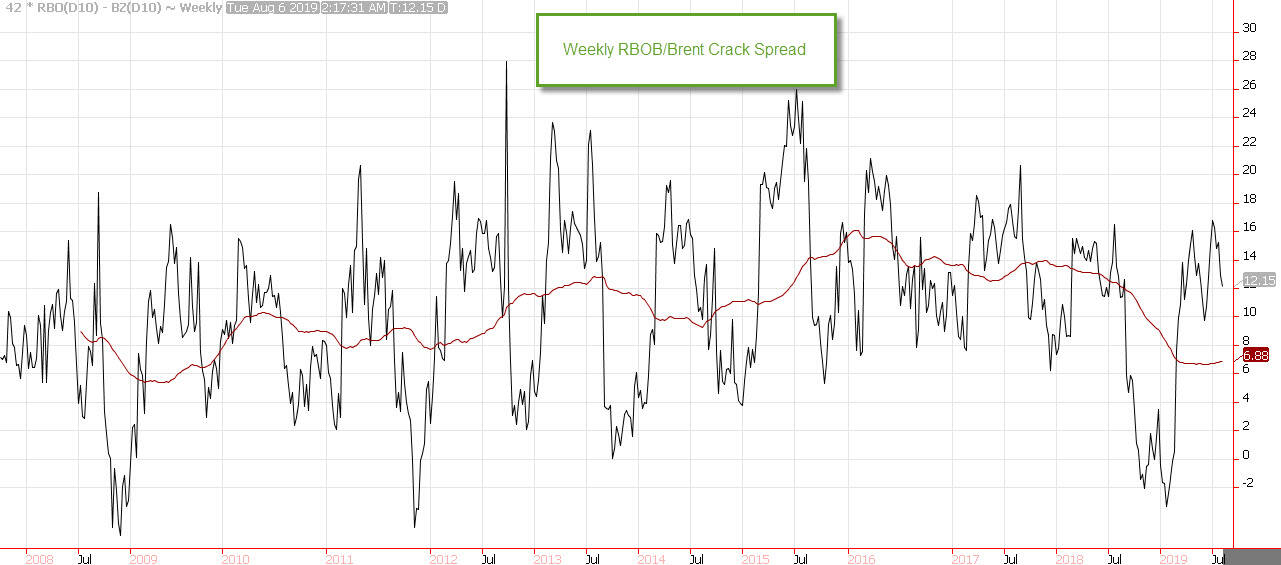
The RBOB/Brent crack spread fluctuates over time, influenced by various market factors. By analyzing historical data, traders and refiners can gain insights into market trends and make informed decisions. The weekly chart of the RBOB/Brent crack spread demonstrates the range of crack spread values, with highs of $28 per barrel and lows of -$5.5 per barrel.
Negative crack spreads indicate a lack of incentive for refiners to purchase and refine Brent oil. This typically occurs during recessions or when Brent oil prices are artificially buoyed by supply disruptions. Conversely, when the crack spread is elevated and the price is well above the cost for refiners to convert Brent into RBOB, there is a strong incentive to purchase and refine as much crude oil as possible.
Brent vs. WTI: Another Crucial Spread
Apart from the RBOB/Brent crack spread, another important spread in energy trading is the difference between Brent and WTI (West Texas Intermediate) crude oil. WTI is the US benchmark crude oil and is actively traded in the refining process to produce gasoline. The spread between Brent and WTI is a significant metric for refiners as both producers compete for the same refiners as customers.
WTI is quoted on the Chicago Mercantile Exchange for pickup in Cushing, Oklahoma. The spread between Brent and WTI can vary, reaching highs of $28 per barrel and lows of -$3.6 per barrel. When the spread is elevated, US refiners are incentivized to purchase WTI over Brent, and when the spread is negative, the reverse is true.
In Summary
The RBOB/Brent crack spread and the Brent vs. WTI spread are key metrics in energy trading. These spreads allow traders and refiners to assess the profitability of refining activities and make informed decisions based on market trends. The RBOB/Brent crack spread measures the difference between the price of RBOB gasoline and the price of Brent crude oil, while the Brent vs. WTI spread compares the global benchmark of crude oil with the US benchmark. By understanding and analyzing these spreads, participants in the energy market can navigate the complexities of the industry and optimize their trading strategies.